Visualize Your Logs: Integrating Promtail, Loki, Prometheus, and Grafana for Improved Monitoring

In this blog, I built a simple Laravel application that prints "Hello, World." Next, I'll set up containers for this app and then keep an eye on its logs.
Tools
To accomplish this, I utilized several tools and agents:
Promtail: This agent collects logs from various sources, including files and Docker containers, and forwards them to Loki. It's essentially responsible for gathering logs for storage.
Loki: A log aggregation system designed for efficient log storage and retrieval.
Grafana: An open-source analytics and monitoring platform that allows users to visualize and analyze data from multiple sources through customizable dashboards. It is commonly used for monitoring metrics, logs, and application performance.
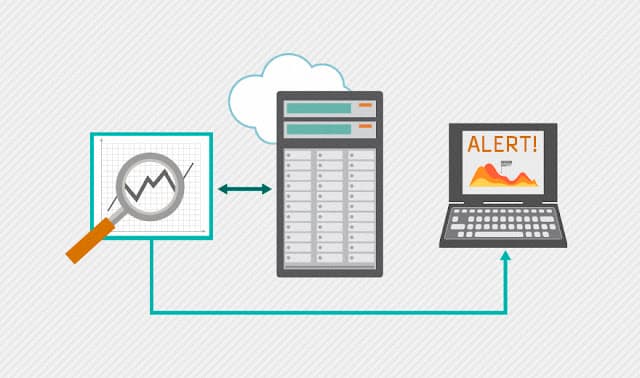
Architecture

Compose file for Setting up containers
To set up this task, I pulled Docker images for Promtail, Loki, and Grafana. Then, I created a Compose file to run all the containers within a single network called "monitoring." Let's check out the Compose file together.
services:
  laravel-app:
    image: laravel-app
    container_name: laravel-cont
    build:
      context: /home/aditya/laravel/helloworld #Add path of dockerfile to make laravel-cont
    ports:
      - "8555:80"
    networks:
      - monitoring  # Use the monitoring network

  prometheus:
    image: prom/prometheus
    container_name: aditya-prometheus
    volumes:
      - ./prometheus.yml:/etc/prometheus/prometheus.yml
    ports:
      - "8556:9090"
    command:
      - --config.file=/etc/prometheus/prometheus.yml
    networks:
      - monitoring  # Use the monitoring network

  promtail:
    image: grafana/promtail:2.7.1
    container_name: aditya-promtail
    networks:
      - monitoring  # Changed to monitoring
    volumes:
      - ./promtail-config.yaml:/etc/promtail/config.yaml
      - /var/lib/docker/containers:/var/lib/docker/containers:ro
      - /var/log:/var/log:ro
    command: -config.file=/etc/promtail/config.yaml
    depends_on:
      - loki

  grafana:
    image: grafana/grafana
    container_name: aditya-grafana
    ports:
      - "8557:3000"
    environment:
      - GF_SECURITY_ADMIN_USER=admin
      - GF_SECURITY_ADMIN_PASSWORD=admin
    networks:
      - monitoring  # Use the monitoring network
    depends_on:
      - prometheus
      - loki

  loki:
    image: grafana/loki
    container_name: aditya-loki
    volumes:
      - ./loki-config.yaml:/etc/loki/loki-config.yaml
    command: -config.file=/etc/loki/loki-config.yaml
    ports:
      - "8558:3100"
    networks:
      - monitoring  # Use the monitoring network

volumes:
  postgres_data:
  grafana_data:
  loki-data:

networks:
  monitoring:
    driver: bridge
Here's the Docker file located at /home/aditya/laravel/helloworld
FROM php:8.2-apache

# Install dependencies
RUN apt-get update && \
    apt-get install -y \
    libzip-dev \
    zip

# Enable mod_rewrite
RUN a2enmod rewrite

# Install PHP extensions
RUN docker-php-ext-install pdo_mysql zip

ENV APACHE_DOCUMENT_ROOT=/var/www/html/public
RUN sed -ri -e 's!/var/www/html!${APACHE_DOCUMENT_ROOT}!g' /etc/apache2/sites-available/*.conf
RUN sed -ri -e 's!/var/www/!${APACHE_DOCUMENT_ROOT}!g' /etc/apache2/apache2.conf /etc/apache2/conf-available/*.conf

# Copy the application code
COPY . /var/www/html

# Set the working directory
WORKDIR /var/www/html

# Install composer
RUN curl -sS https://getcomposer.org/installer | php -- --install-dir=/usr/local/bin --filename=composer

# Install project dependencies
RUN composer install

# Set permissions
RUN chown -R www-data:www-data /var/www/html/storage /var/www/html/bootstrap/cache
Note: Make sure you have a laravel-app that contains all necessary files.
In the same directory where the Compose file is located, please add the following files:
1. prometheus.yml
Purpose: This file configures Prometheus to scrape metrics from Loki. It defines the scrape interval and specifies the targets for monitoring.
global:
  scrape_interval: 15s

scrape_configs:
  - job_name: 'loki'
    static_configs:
      - targets: ['loki:3100']
2. loki-config.yml
Purpose: This configuration file sets up Loki's parameters, such as the server port, storage configurations, and ingester settings. It determines how logs are stored and indexed.
auth_enabled: false

server:
  http_listen_port: 3100

ingester:
  wal:
    enabled: true
    dir: /loki/wal
  chunk_idle_period: 1m
  max_chunk_age: 1h

schema_config:
  configs:
    - from: 2020-10-01
      store: boltdb-shipper
      schema: v11
      index:
        prefix: index_
        period: 24h

storage_config:
  boltdb_shipper:
    active_index_directory: /loki/index
    cache_location: /loki/cache
    shared_store: filesystem
  filesystem:
    directory: /loki/chunks

limits_config:
  max_query_series: 500000
3. promtail-config.yaml
Purpose: This file configures Promtail to scrape logs from the specified locations (like Docker containers) and send them to Loki. It also sets the server port and the position file to keep track of the last read log positions.
server:
  http_listen_port: 9080

positions:
  filename: /tmp/positions.yaml

clients:
  - url: http://aditya-loki:3100/loki/api/v1/push


scrape_configs:
  - job_name: docker
    static_configs:
      - targets:
          - localhost
        labels:
          job: docker
          __path__: /var/lib/docker/containers/*/*.log  # Path to Docker logs
Now, set up containers using Docker Compose file.
command:
docker-compose build
docker-compose up -d (run containers in detached mode)
Accessing the containers:
Laravel application: http://server-ip:8555

Prometheus: http://server-ip:8556

Grafana: http://server-ip:8557
Add loki as datasource
In the URL, make sure to enter the right container name and port.

Visualize logs using the filename and containerID

Here, in the directory /var/lib/docker/, you'll find the ID for each container, and you can easily forward their logs to Loki.
Oh, wait! In my upcoming blog, I'll dive deeper into this topic and also include a step-by-step guide on setting up alerts. Make sure to check it out!